Understanding Central Venous Pressure: Not a Preload Index?

Highlights
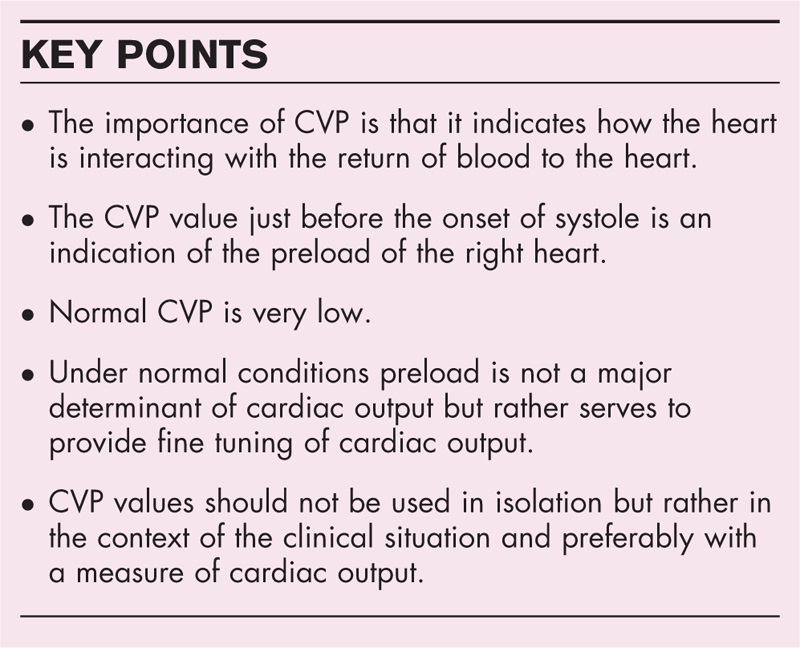 (View Highlight)
- The ‘a’ wave is the first positive deflection in the cardiac cycle and is determined by atrial contraction when the rhythm is driven by the sinus node (Fig. 1). The height of this wave depends upon the force of contraction of the atrium and the compliance of the atrium, right ventricle, and upstream veins (View Highlight)
- The second positive deflection is the ‘c’ wave which is small and often hard to see. It is produced by buckling of the tricuspid wave back into the atrium during the beginning of right ventricular contraction and also possibly by a reflection wave from the venous return hitting the suddenly closed tricuspid valve (View Highlight)
- The third positive deflection is the ‘v’ wave. It is produced by filling of the atrium during ventricular systole. The magnitude of the ‘v’ wave is primarily determined by the amount of volume returning to the heart per beat (‘stroke return’) and the compliance of the right atrium and upstream venous vessels (View Highlight)
- CVP only reflects right ventricular diastolic pressure when the tricuspid valve is open (View Highlight)
 (View Highlight)
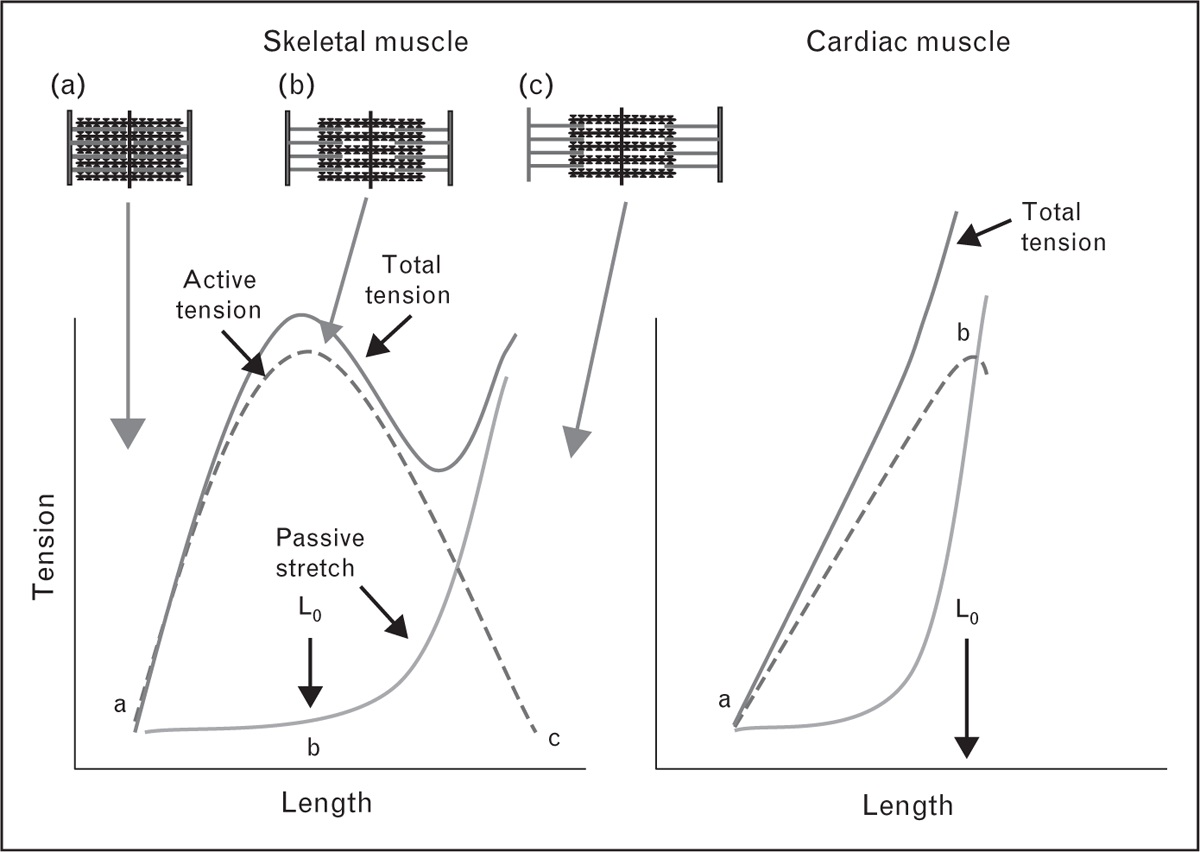
- In skeletal muscle increasing the passive length increases active tension generation until an optimal length is reached (Lo). This occurs when overlap of actin and myosin is optimal. Stretching muscle beyond this point results in a decrease in active force because of a decrease in the optimal overlap. In contrast to skeletal muscle, Lo occurs on the steep part of the passive filling curve which prevents overstretching of the heart and there is no downward component to the length–tension relation. (View Highlight)
- perhaps the most important reason for using pressure rather than volume is that the maximum diastolic volumes of the right and left ventricles cardiac chambers are limited by the pericardium when it is intact and by the cardiac cytoskeleton when there is no pericardium. When this limit of diastolic filling is reached, further increases in ventricular filling pressure do not change end-diastolic volume. Volume measurements do not detect that this important limit has been reached (View Highlight)
- 4).
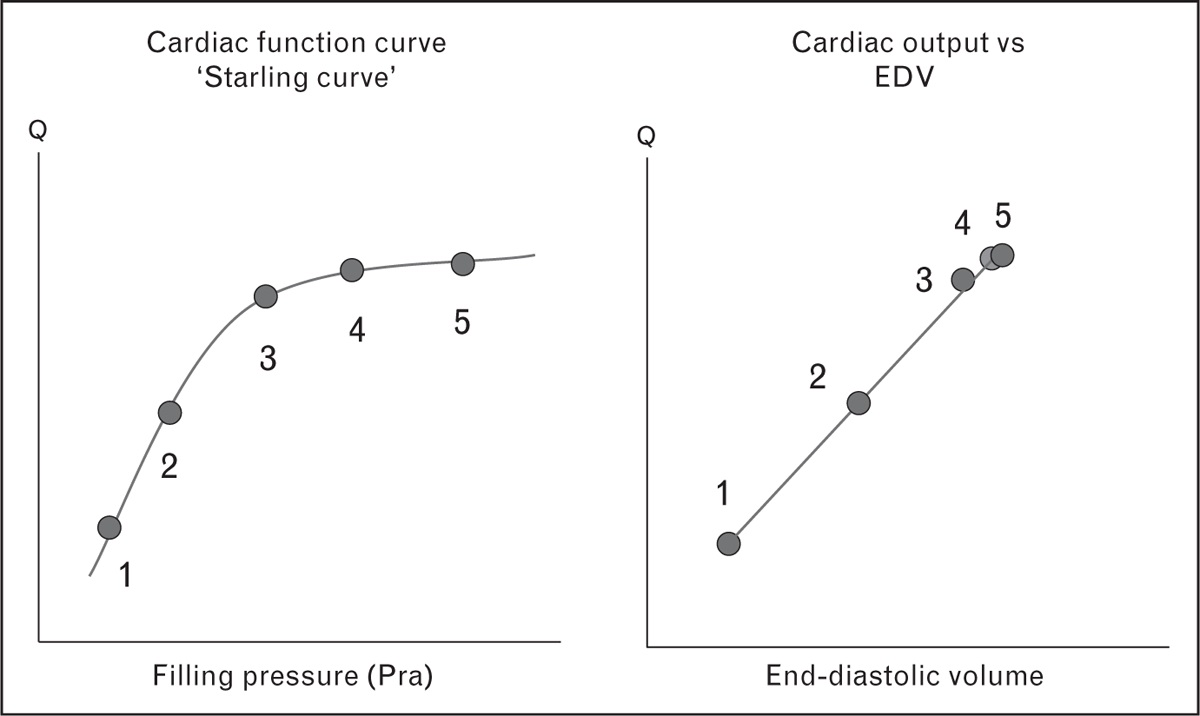
Cardiac output plotted against right atrial pressure (Pra) (left) and against end-diastolic volume (EDV) (right). The plot of cardiac output against pressure in the classic Starling curve is curvilinear. The plot of cardiac output against end-diastolic volume is linear which would seem to make this the more useful plot. The Starling plot can, however, identify the plateau of cardiac function when the limit of passive stretch is reached but on the plot of cardiac output against end-diastolic volume the points just cluster in this range and it is hard to identify the limit (View Highlight)
- Under normal circumstances the resistance between the large veins, right atrium and right ventricle during diastole is negligible and CVP gives a good estimate of the right ventricular diastolic pressure (View Highlight)
- Three general types of energy determine vascular pressures: elastic, kinetic, and gravitational energy. (View Highlight)
- Errors in measurement of the CVP can be because of errors in leveling, errors in identification of changes in pressure related to changes in pleural pressure (incorrect estimates of transmural pressure), and errors in choosing the proper place on the tracing to measure the CVP value that estimates preload (View Highlight)
- vascular pressures are made at end-expiration, which is when pleural pressure is closest to atmospheric pressure (View Highlight)
- When CVP is used to estimate preload the measurement should be made at the base of the ‘c’ wave which is called the ‘z’ point for this point indicates the last pressure in the right heart before the onset of systole. If the ‘c’ wave cannot be identified the base of the ‘a’ gives a reasonable estimate. The timing of the onset of systole also can be made by drawing a vertical line from the end of the QRS wave of the electrocardiogram. If this value is reported as the CVP measurement, this CVP value gives a good estimate of preload. (View Highlight)
- If a heart is studied in isolation, as was the case in Otto Frank's studies, CVP gives a clear estimate of the preload of the heart. In the intact circulation CVP is determined by the interaction of two functions – cardiac function and return function (View Highlight)
- under resting conditions only about 30% of total blood volume produces the venous elastic recoil that drives blood back to the heart [3,17|3,17]. The rest of the blood volume simply rounds out vessels and does not stretch vascular walls. This is called unstressed volume. Changes in the proportion of stressed to unstressed volume can change venous return and thus change CVP without a change in total blood volume. The consequent increase in preload, though, increases cardiac output if the right heart is not volume limited (View Highlight)
- elastic recoil from the veins passes through a resistance in downstream veins. Changes in this resistance will alter the relation of total blood volume to CVP (View Highlight)
- CVP is determined by the interaction of cardiac function and return function so that if a change occurs in cardiac function at the same time as a change in return function from a change in blood volume, the relation of CVP to blood volume also will change (View Highlight)
- Under normal physiological conditions, preload is not a major determinant of cardiac output, but rather acts by ‘fine-tuning’ cardiac output so that inflow matches outflow. It is very helpful clinically that many patients respond to an increase in preload with an increase in cardiac output, but a normal cardiovascular system should not need this increase in blood volume. (View Highlight)